
RSI: The Momentum Edge for Natural Gas Traders
- Timothy Beggans

- Jul 3, 2025
- 2 min read
In the fast-moving world of natural gas trading, where prices swing on weather forecasts, storage reports, and geopolitical shifts, understanding momentum is essential. One of the most effective tools for doing so is the Relative Strength Index (RSI).
What is RSI?
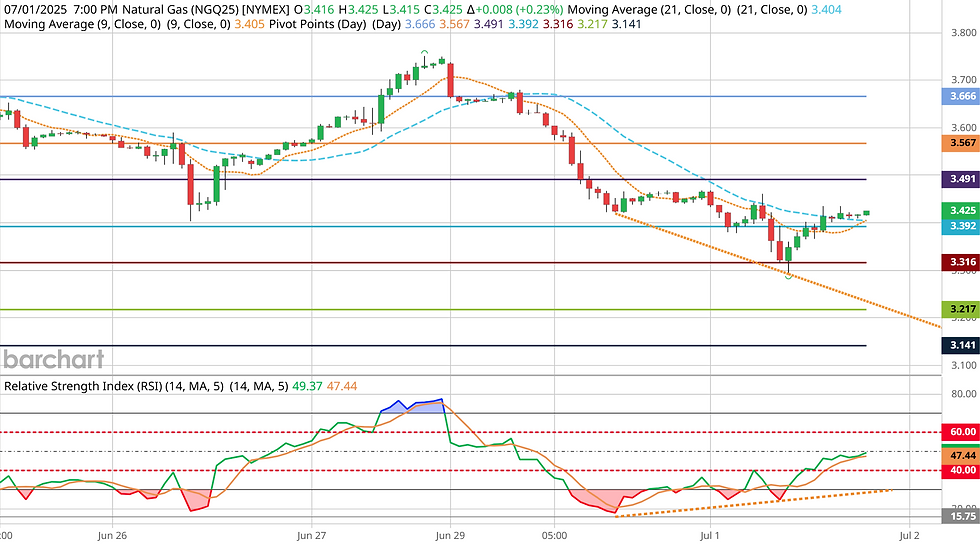
Developed by J. Welles Wilder, RSI is a momentum oscillator that measures the speed and magnitude of recent price changes. RSI compares average price gains to losses over a typical 14-period timeframe (e.g., 14 days for daily charts or 14 hours for intraday trading). The formula is: RSI = 100 - (100 / (1 + RS)), where RS = Average Gain / Average Loss. The result moves between 0 and 100:
Above 70: Overbought
Below 30: Oversold
Around 50: Neutral (lacking strong momentum)
In trending markets, these ranges shift. RSI readings between 40–80 often suggest bullish momentum, while 20–60 indicate bearish conditions.
Why RSI Matters in Natural Gas
Natural gas is among the most volatile commodities. RSI reveals momentum strength, showing if a move is sustainable or nearing reversal, aiding traders’ timing.
Reversal Signals: Divergence Patterns
Bullish divergence: Price makes lower lows, but RSI forms higher lows. This hints that selling momentum is fading, and a reversal could be coming.
Bearish divergence: Price makes higher highs, but RSI shows lower highs. This signals weakening buying pressure and a potential downturn. These divergence signals are critical in natural gas markets, where extreme moves driven by weather or supply shocks often precede sharp corrections.
Conclusion
RSI stands out for its simplicity, clarity, and predictive power. Paired with indicators like MACD, RSI helps traders navigate the volatility of natural gas markets with confidence, spotting turning points before they appear on the price chart.


Comments